I have been learning stochastic calculus, and one of the crucial facts is that the standard deviation of a random walk is equal to log(time).
Here is a concrete example:
Suppose a stock is trading at $100. Everyday it can change anywhere from +$5 to -$5. What does the distribution of the stock price at day 20 look like?
It would look like a normal distribution because the price is a sum of binary random variables (a random walk). What is interesting is that the standard deviation of the distribution grows with the log of time.
That means that the stock price stays extremely close to the starting value over time even if its a random walk. The random walk will cross $100 infinitely many times as time goes to infinity as well.
Here is a picture:
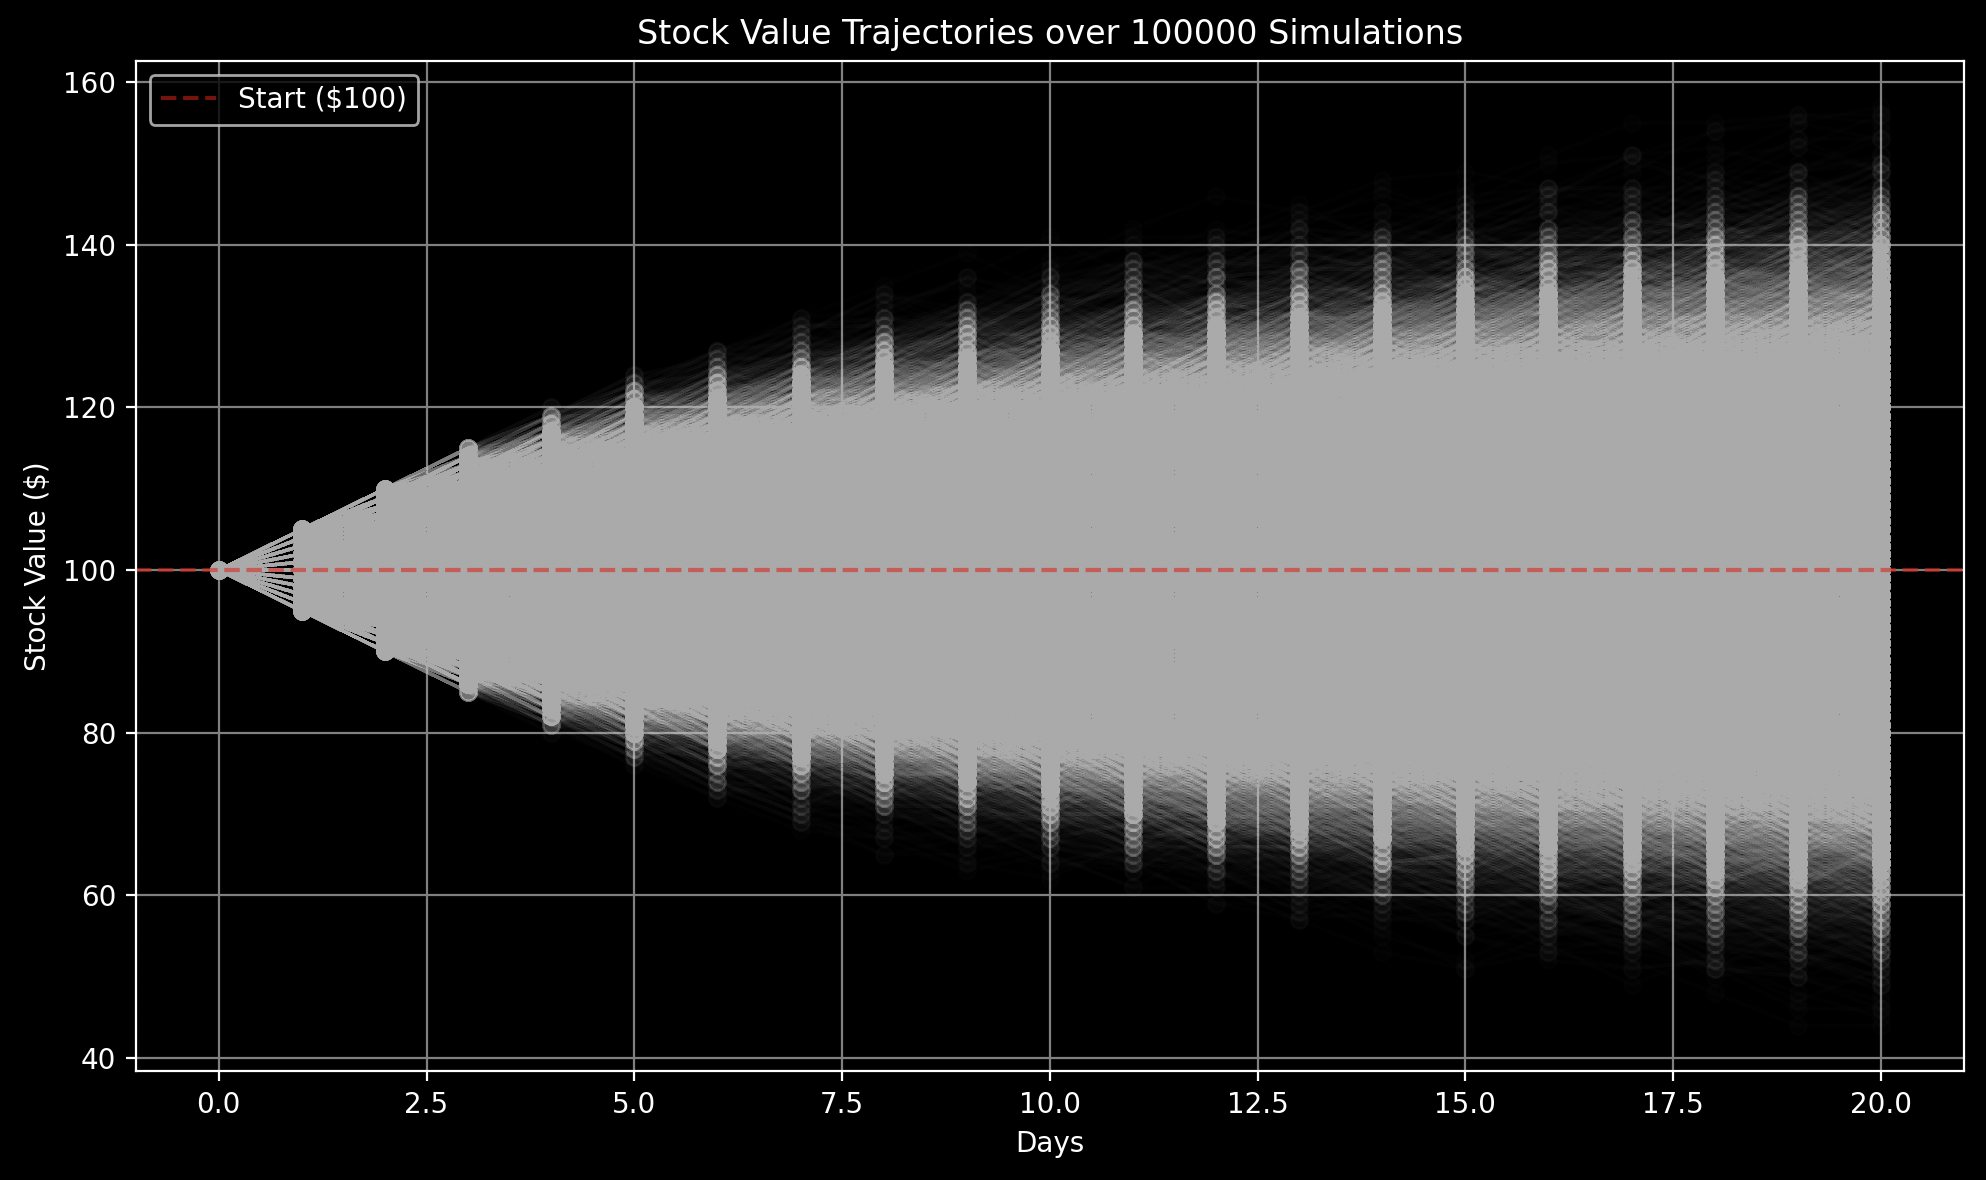
Notice how spread out the probability density is grows with the logarithm of time.